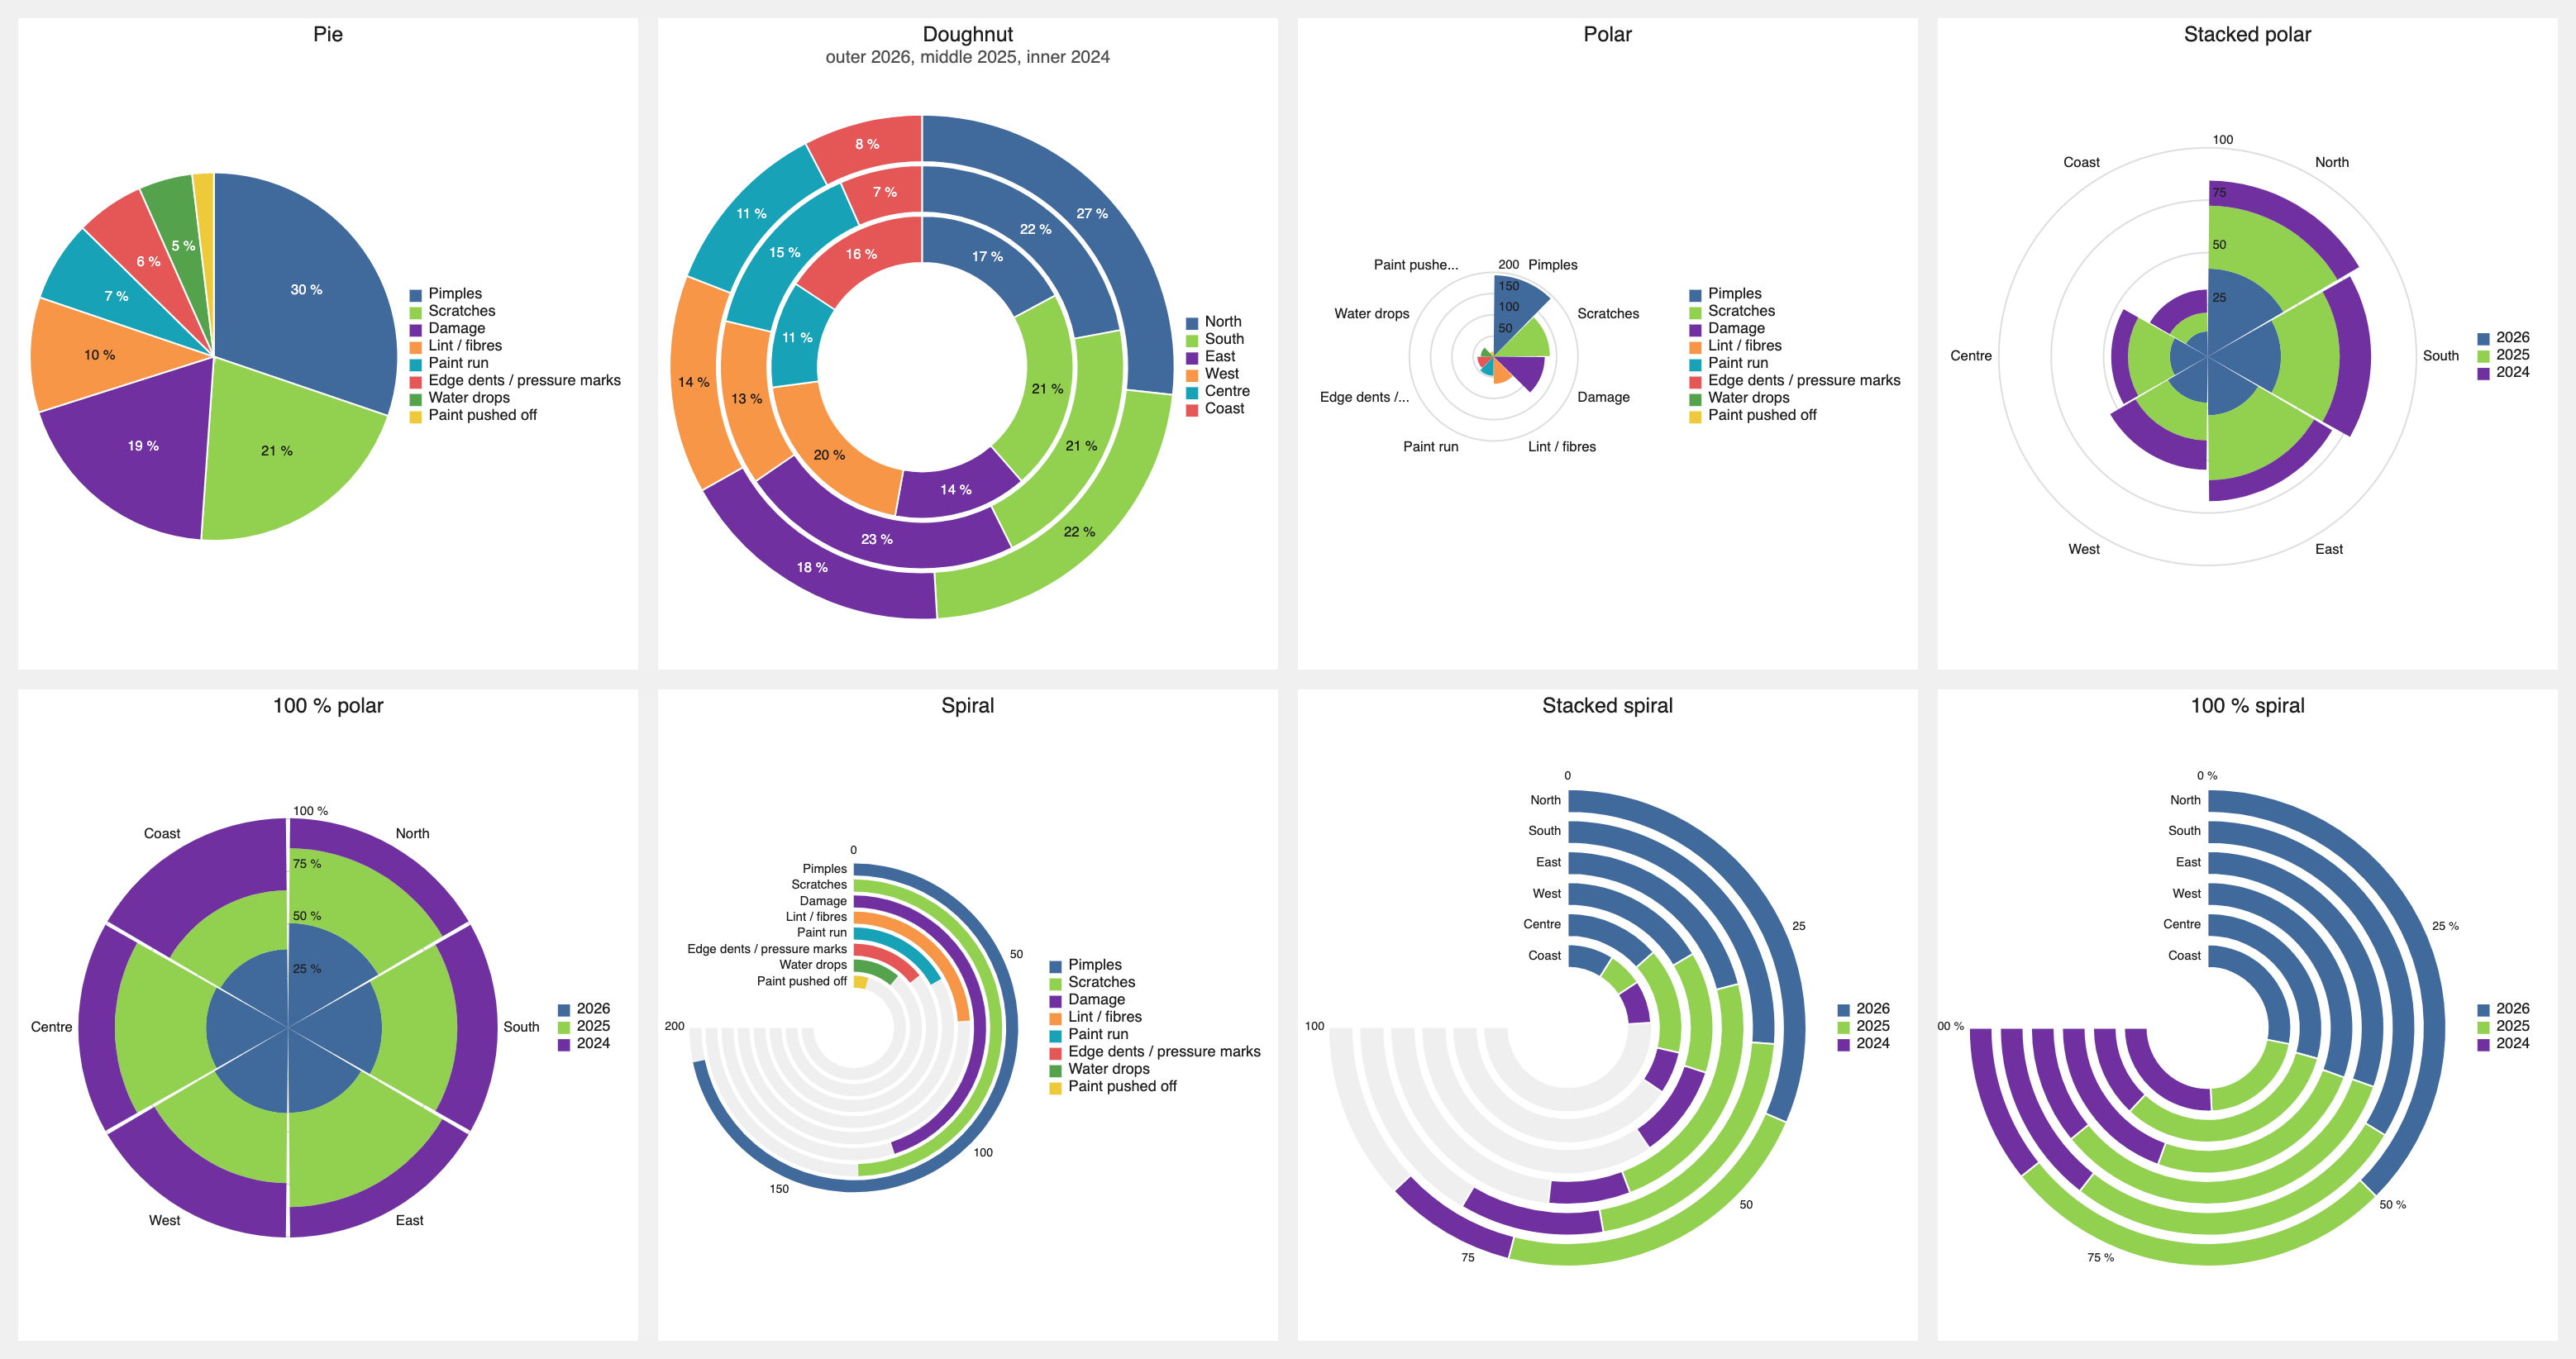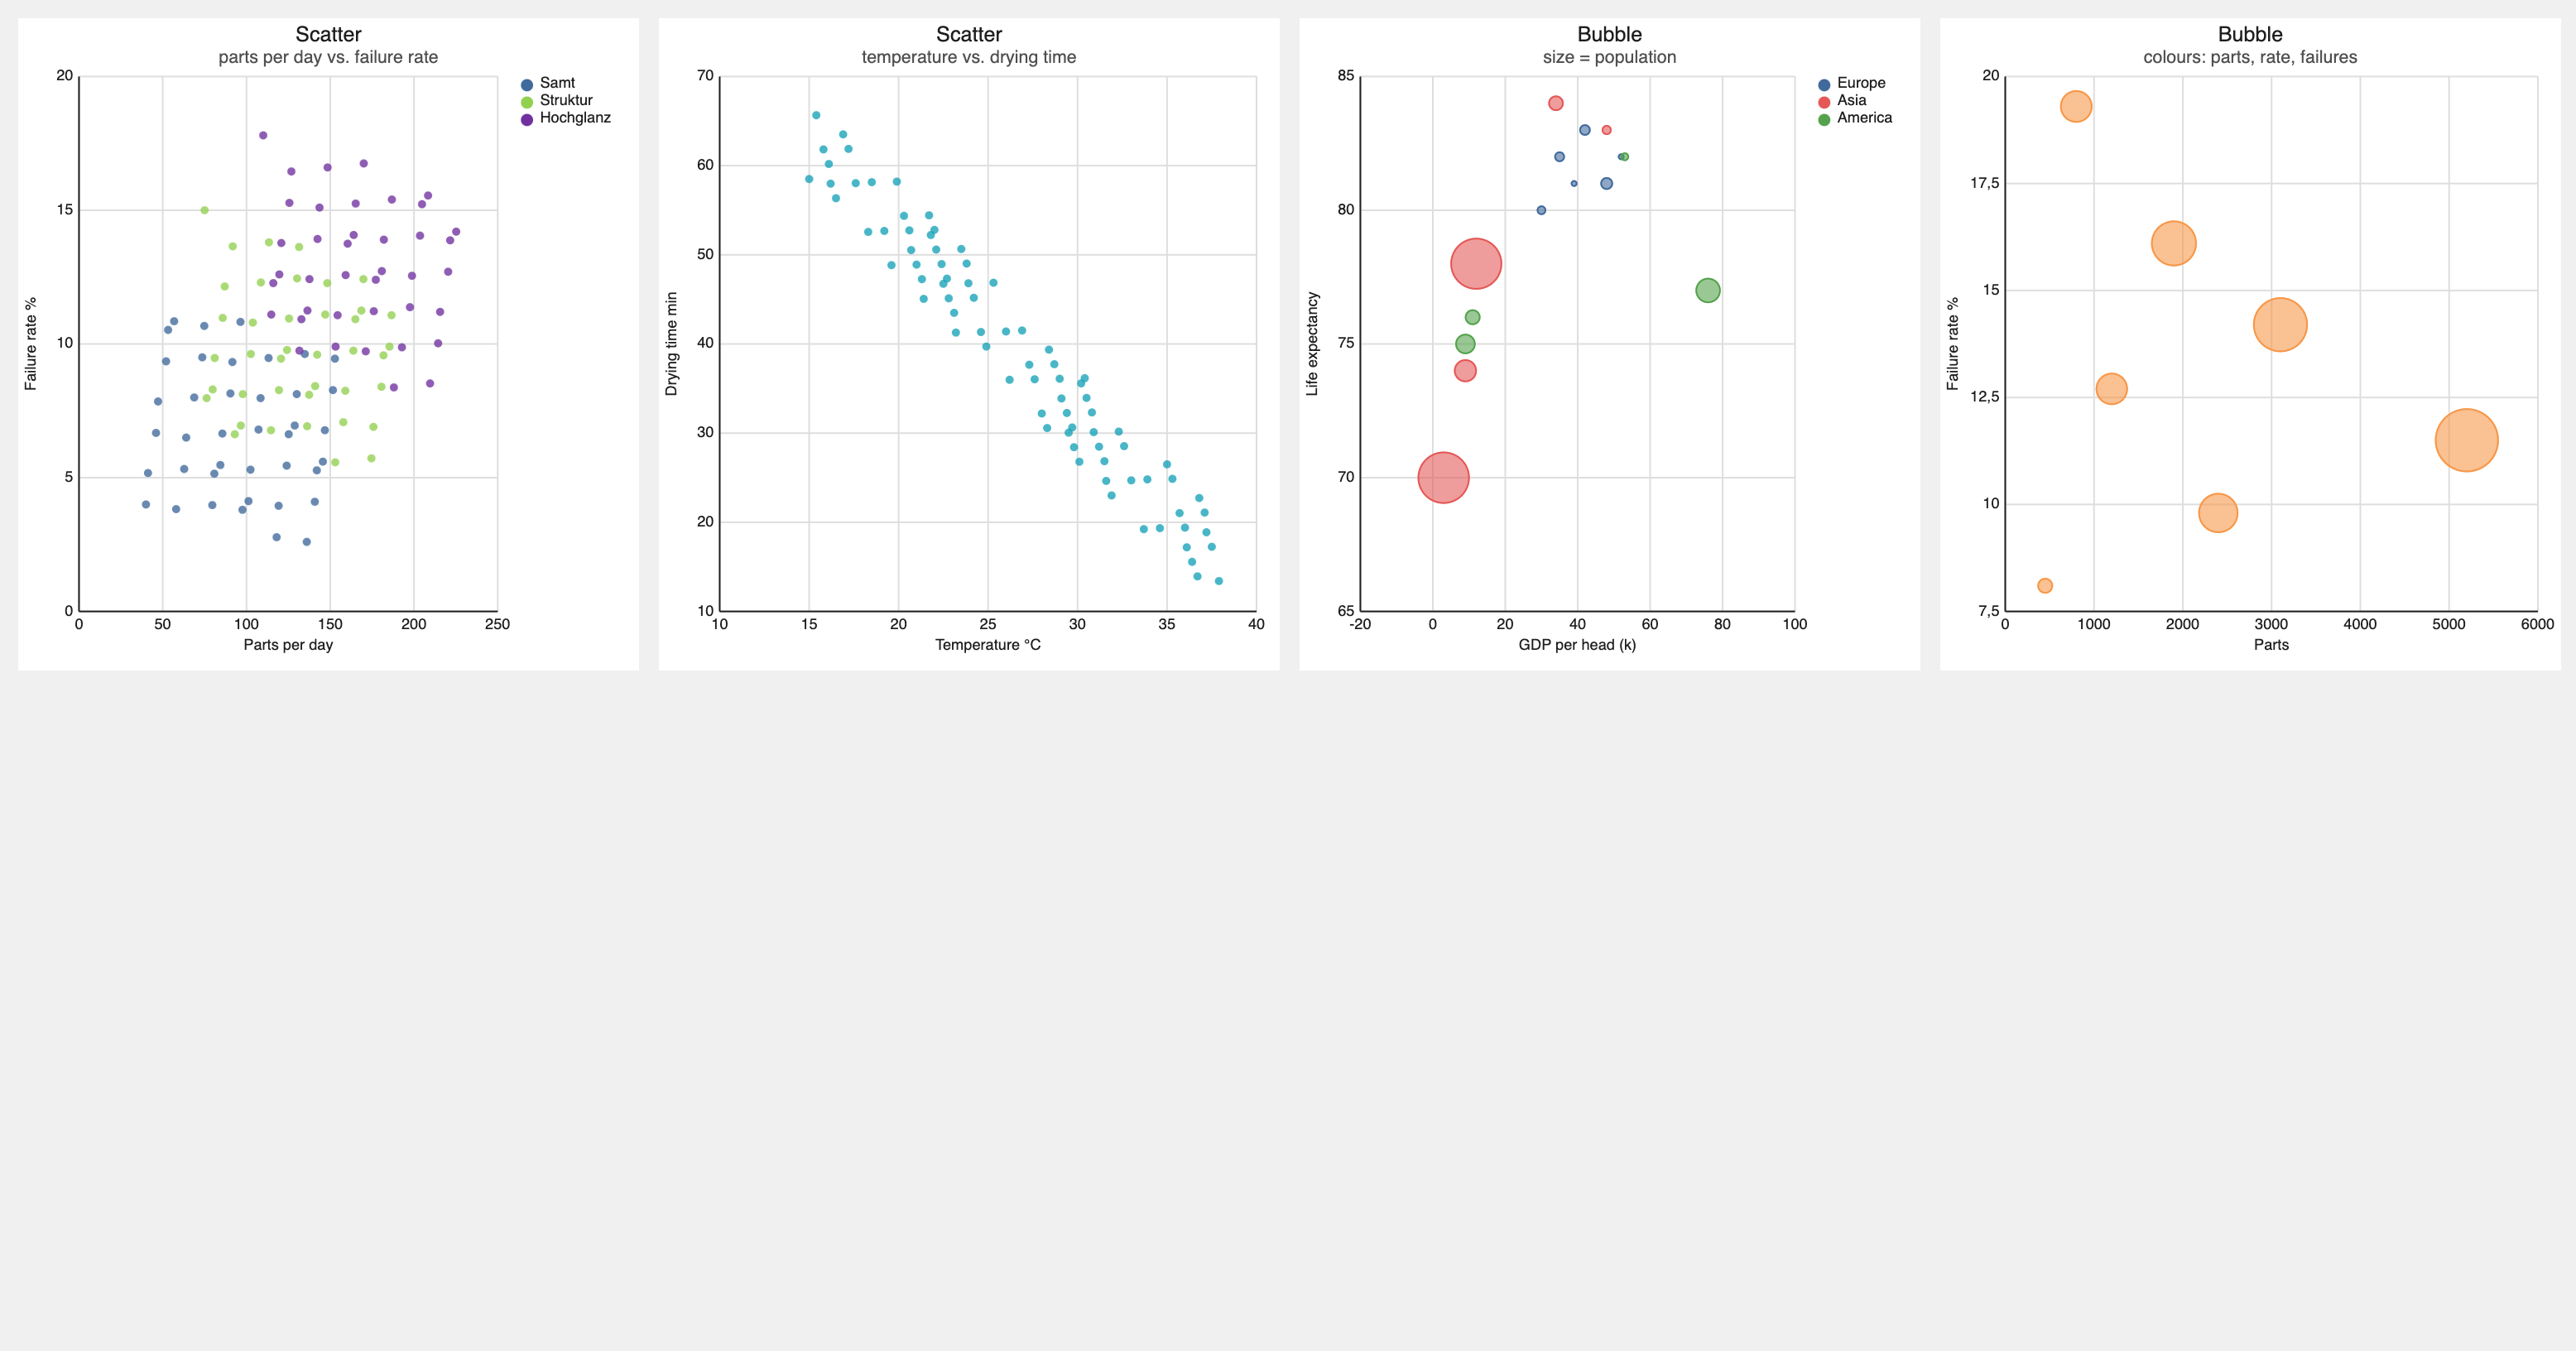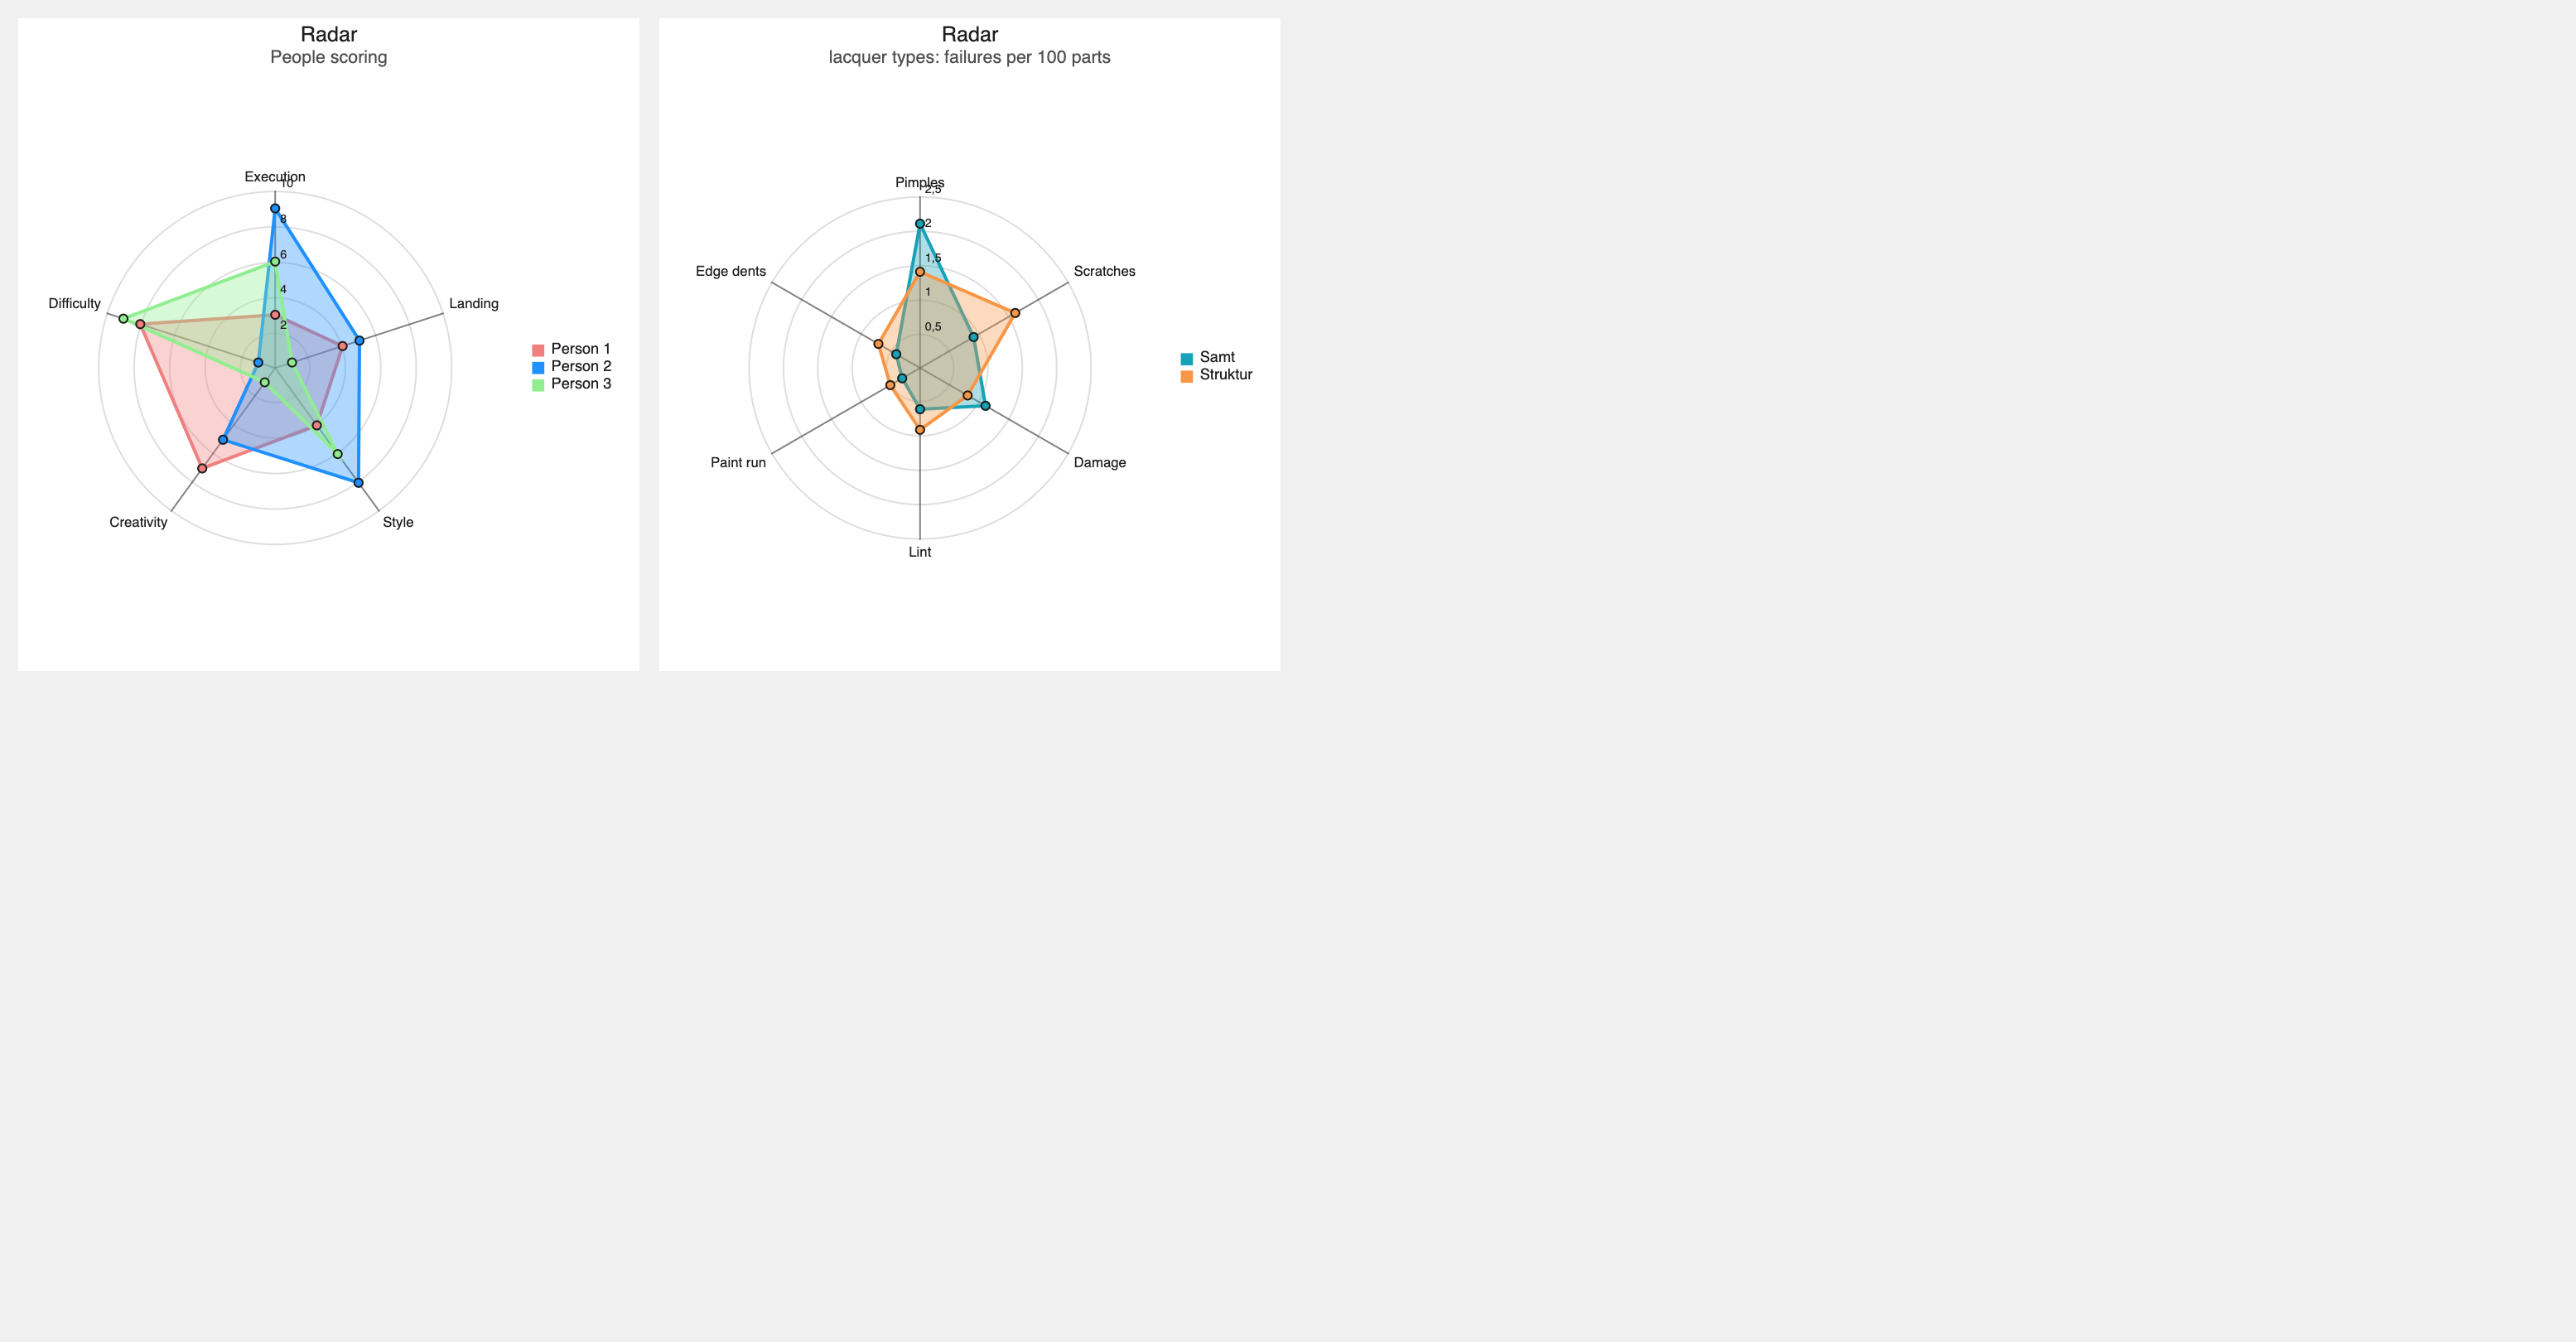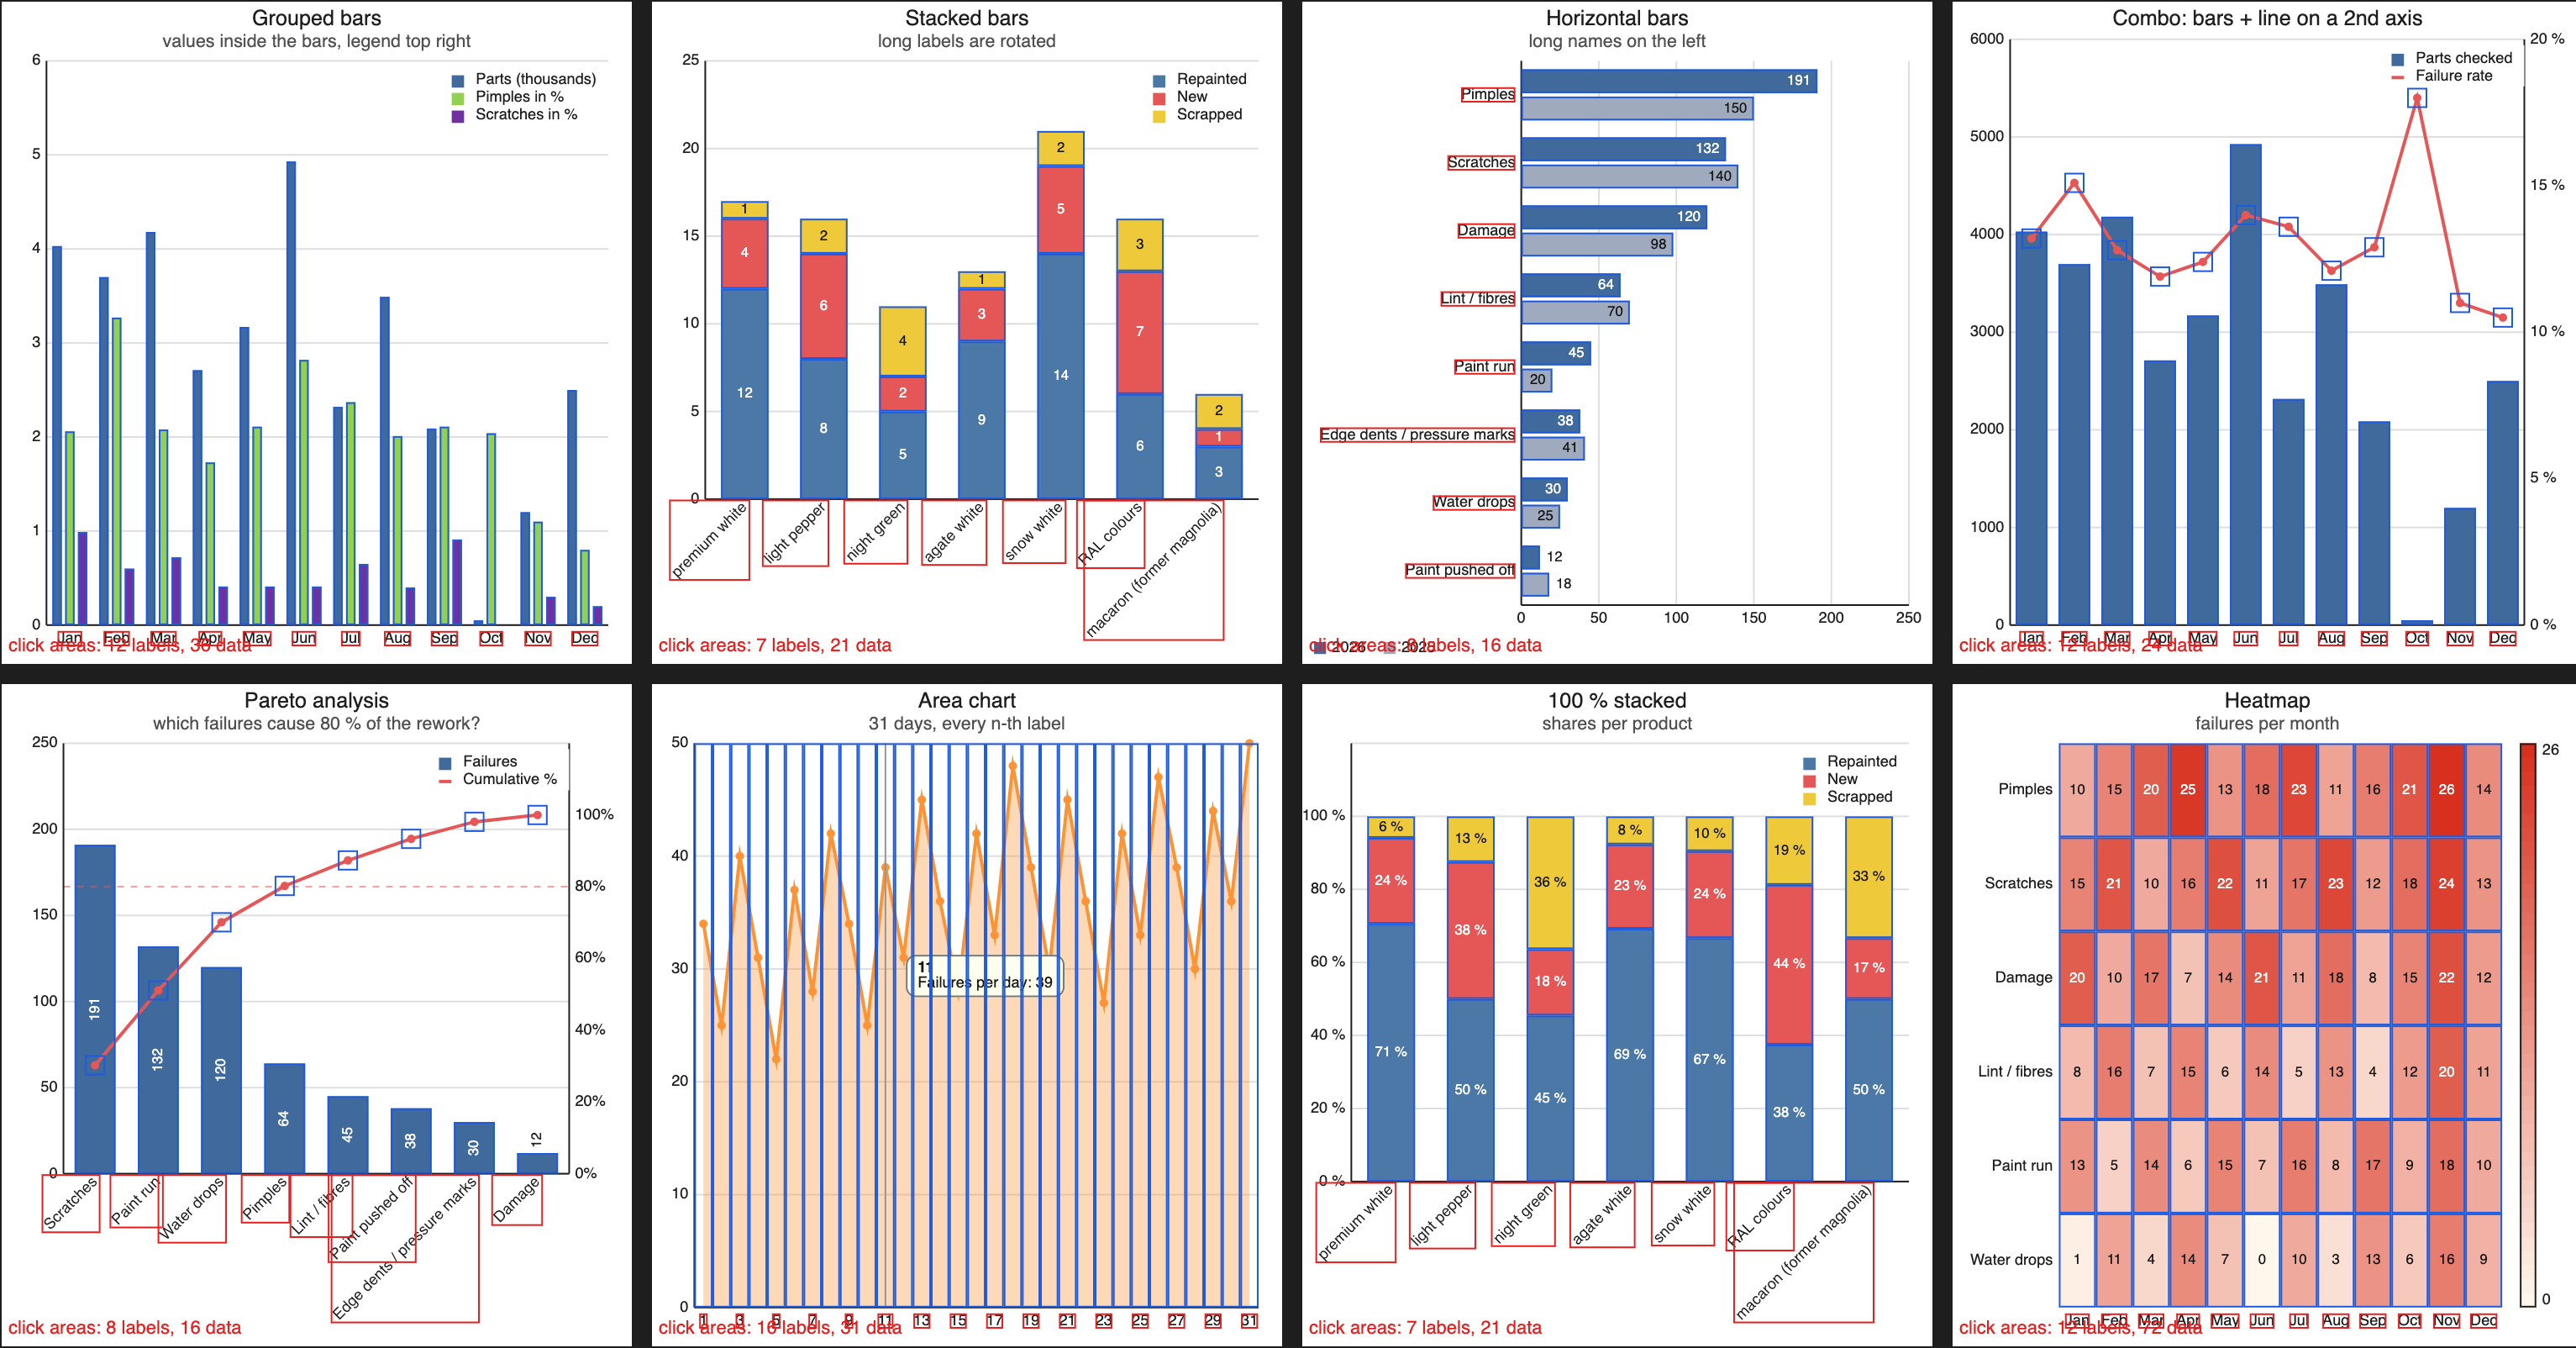
ChartView packs a whole charting toolkit into one self-contained Canvas subclass: 32 chart types, drawn in pure Objo code with no plugins, no dependencies and no native code. Copy the class into a project and you are done.
Everything from grouped, stacked and horizontal bars to Pareto charts, heatmaps, radar charts, candlesticks and Gantt charts on a real date axis. Every chart is styleable, clickable, and vector-sharp in print and PDF export.
Highlights
- 32 chart types, one class. Grouped, stacked, 100% and horizontal bars; plain, smooth, stacked and 100% lines and areas; combo charts with a second axis; Pareto with the 80% line; heatmaps; funnel and pyramid; scatter and bubble charts, with bubble area proportional to value; candlestick, HLOC and Gantt on a real date axis; radar; and pie, doughnut, polar and spiral charts in three flavours each.
- Made to be clicked. Tooltips follow the mouse and hit-testing is pixel-exact on every wedge.
SeriesClickedreports the series and point the user picked,LabelClickedfires on category labels (rotated X-axis labels included), andChartContextClickhands you the coordinates for context menus. SetRightClickOnChart = Falseto reserve right-clicks for labels alone, andShowClickAreas = Truedraws every clickable area when you want to see them. - Fully styleable. Colours, fonts and corners are yours to set, with legends, subtitles and axis titles built in, and number formats in German or English.
- Vector-sharp output. Printing and PDF export are true vector graphics: zoom in to 6400% and every line is still crisp.
- Easy to use. Set a kind, hand it labels and a series, add it to the window. That is the whole ceremony.
Using it in code
Var chart As New ChartView
chart.Kind = ChartView.KindPareto
chart.Title = "Support tickets by cause"
chart.SetLabels(["Setup", "Login", "Sync", "Export"])
chart.AddSeries("Tickets", [191, 132, 45, 12])
Self.Add(chart)
A Pareto chart sorts itself, totals the cumulative line and draws the 80% marker for you. The bundled demo project shows every chart type with its options.
Requirements
- No plugins, no dependencies, no native code:
ChartViewis a single pure Objo class you copy into your project.
Getting started
- Download the archive and open the demo project in Objo Studio, or copy the ChartView class straight into your own project.
- Create a chart in code: set
Kind, callSetLabelsandAddSeries, then add it to a window. - Browse the demo project to see all 32 chart types, the styling options and the click events in action.
Licence
ChartView is free for private, educational and non-commercial use. Commercial use requires an inexpensive licence from the author: send @madru a private message on the forum.
About
ChartView is written and maintained by @madru (Guido), who also built the Game Boy Core plugin, the Game Boy Emulator app, Minesweeper and Sokoban in this showcase.